Elliott Wave Structure:
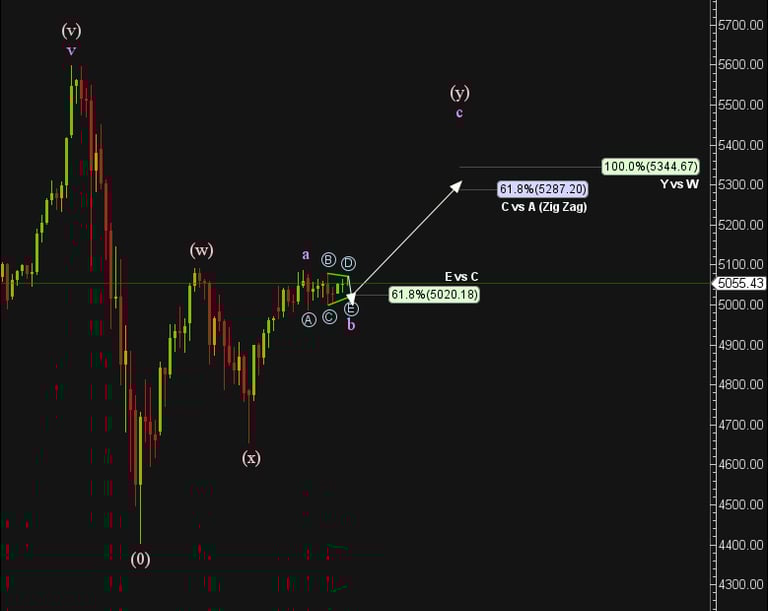
The decline from the high formed a clear 3-wave move into Wave (w).
Wave (x) has unfolded as a zigzag correction.
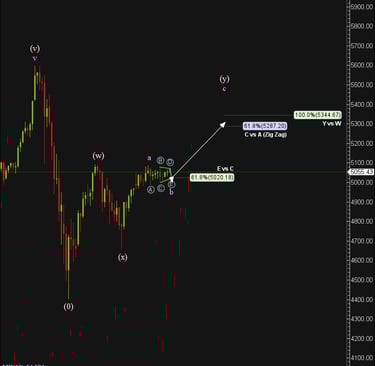
Wave (y) is underway, and the current triangle suggests Wave b of (y) is nearly complete, setting the stage for Wave c.
Triangle Characteristics:
Labeled a–b–c–d–e, with converging trendlines and decreasing momentum.
The E vs C 61.8% projection aligns with $5,020, offering strong support.
Breakout confirmation would come with a sustained move above $5,100.
Upside Targets:
$5,287 = 61.8% extension of Wave A vs C (Zigzag projection).
$5,344 = 100% equality between Wave Y and Wave W — a common target in complex corrections.
Key Technical Takeaways:
Momentum is compressing inside the triangle — a breakout is likely imminent.
Completion of Wave (b) should lead to a swift and directional Wave (c).
This structure supports a bullish bias while the $4,990 zone holds as support.
Time Consideration:
Triangles typically resolve in a complex, time-consuming manner; a clean break above the B-D trendlinewith sustained momentum will confirm the structure.
Conclusion: Gold is coiled for a potential breakout from a textbook Elliott Wave triangle. If the bullish thesis plays out, traders should monitor the $5,100 level for confirmation of strength and watch the $5,287–$5,344 area as a logical upside target zone.
Read our latest analysis on AUDUSD.
For more detailed wave-based forecasts and real-time setups, explore our full library of Market Insights