Free 14-Day Access ON TELEGRAM
GBP/USD – At the Crossroads of a Complex Correction
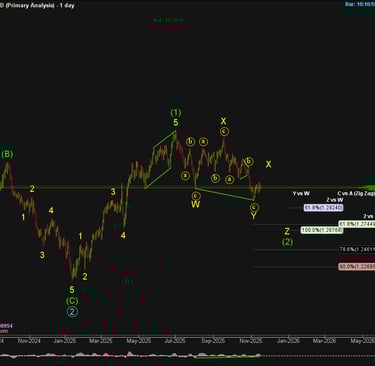
GBP/USD may be nearing the completion of a double zigzag correction, with price finding support near the equality of Waves Y and W. Momentum divergence hints at exhaustion, though alternate counts suggest a possible flat or even a rare triple zigzag if downside pressure continues.
11/17/2025
GBP/USD – At the Crossroads of a Complex Correction
The current structure in GBP/USD suggests that we could be nearing the completion point of a double zigzag correction, with price finding support around the equality of Waves Y and W, as well as the equality between Waves A and C within Wave W.
But why have we labelled it this way — and not as a flat correction?
Let’s break it down.
1. Why the Double Zigzag Count Fits (So Far)
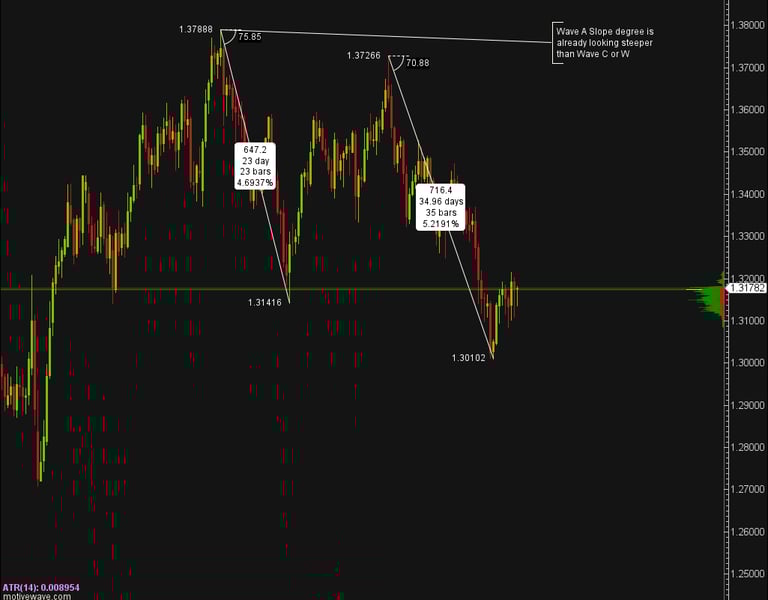
Typically, when price moves three waves down followed by three waves up, retracing more than 80%, it often develops into a Flat correction. However, the internal slope and wave behaviour give us important clues about whether that applies here.
In this case, the slope relationship between Waves A and C doesn’t fit the usual guideline for a flat.
According to Elliott Wave guidelines, in a flat correction, Wave C is usually steeper than Wave A — showing acceleration in an impulsive nature into the low.
Here, however, Wave A is steeper than Wave C, which points more toward a zigzag-type pattern, rather than a typical flat structure.
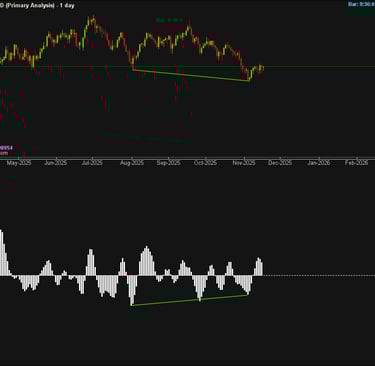
2. Supporting Evidence: Momentum Divergence
We’re also observing MACD divergence between Wave W and Wave Y, another clue suggesting that the downward momentum may be weakening — and that the correction could be approaching its end.
This divergence often marks termination zones in double zigzags, as buyers begin to step in while sellers lose control.
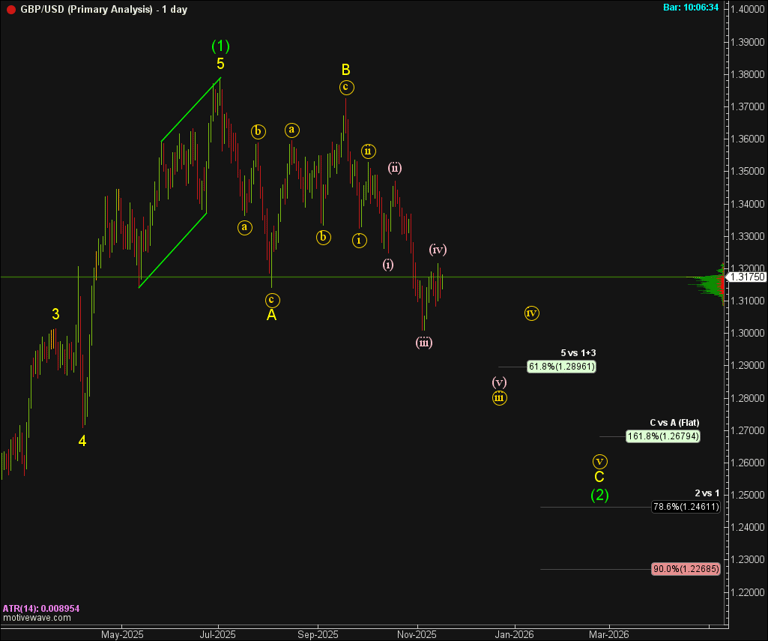
3. The Alternate Count: Flat Still Possible
That said, this guideline — the slope of Wave C vs. Wave A — is not a rule.
There are examples where a flat forms even though Wave C is less steep than Wave A.
Under this alternate scenario, the market could still be in Wave 3 of Wave C, meaning the correction isn’t complete yet, and a deeper retracement could unfold before the next leg higher.
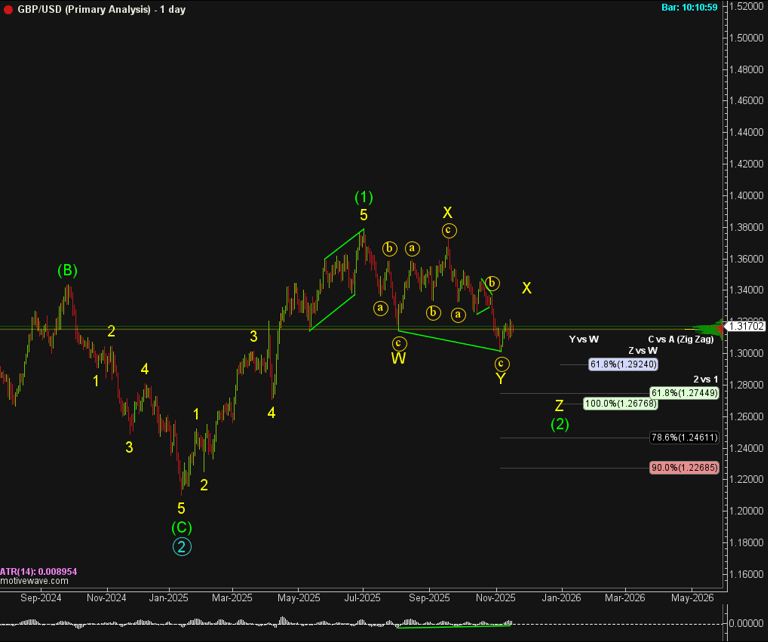
4. Second Alternate Count: A Rare Triple Zigzag
If the market continues to grind lower in a choppy, overlapping fashion — without impulsive downside momentum — we must consider the rare possibility of a triple zigzag forming.
In that scenario, price could extend into the 61.8%–78.6% retracement zone of the entire up-move that began in January 2025, where stronger support may emerge.
Summary
Primary Count → Double Zigzag, possibly complete
Alternate 1 → Flat Correction, Wave C still unfolding
Alternate 2 → Triple Zigzag, deeper retracement possible
Divergence and slope suggest we may be near a termination zone, but confirmation requires structure validation in the coming sessions.
Conclusion:
GBP/USD is at a technical crossroads — either completing a complex corrective structure or preparing for one final leg lower. The slope of the current move and momentum behaviour favour an eventual recovery, but until we see clear impulsive confirmation, caution remains warranted.
Read the new market insight update on UsdCad.
Explore more in-depth charts and wave counts in our full Market Insights section.


Disclaimer:
Trading forex involves significant risk and may not be suitable for all investors. Past performance is not indicative of future results. The information and signals provided on this website are for educational purposes only and should not be considered financial advice. You are solely responsible for your trading decisions and any resulting financial losses. Please consult with a licensed financial advisor before engaging in forex trading.
© 2026. All rights reserved.
Trading Resources: [Market Insights] [Elliott Wave Course] [Forex Signals Guide] Tools: [Economic Calendar ][Position Size Calculator] Support: [FAQ] [Contact] [New To Telegram?]